Research Report
People Power for C-Stores: Using Employee Engagement to Build Business Results
When it comes to business, people matter. Studies consistently show that employee engagement leads to business growth, and that’s why NACS CCRRC chose to study the topic in this three-phase project.
The report explores employee engagement in convenience retail based on survey responses from 20,000 c-store employees and managers across 11 different banners.* The Council wanted to identify what influences employee engagement, how it relates to business growth and where c-stores can improve. The results confirm the reality of these opportunities.
*Participants were invited to take part in a voluntary, web-based survey in which they were asked to respond to 33 questions. No incentives were provided, and all responses would remain confidential.

Introduction
Business is not just about numbers, it’s also about people. Studies consistently show that engaged employees are more efficient, have lower turnover, and generate higher levels of customer satisfaction — which leads directly to greater growth in sales and profits. This is why the CCRRC North America NACS chose to study employee engagement in a three-phase project called “Power Up Your People.”
This report is the final phase of that project. It explores the status of employee engagement in convenience retail based on a survey of 20,000 c-store employees and managers across 11 different banners conducted by the Service Management Group.* Its purpose was to identify:
- How employee engagement and business outcomes are related in the convenience industry.
- Which factors are most important in influencing employee engagement.
- Where the opportunities for improvement are.
This research confirms that improving employee engagement in convenience retail can make a significant difference in business performance, and that there are very real opportunities for c-stores to capture performance gains by improving employee engagement.
Council members who have worked on employee engagement found that their own organizations experienced the greatest gains and long-term success when everyone in the company, from the top down, understood the value of increased engagement and behaved to support it. Together, the three resources developed for this project give convenience retailers the foundation they need to build that understanding, and the guidance they need to get started.
* Participants were invited to take part in a voluntary, web-based survey in which they were asked to respond to 33 questions. No incentives were provided, and all responses would remain confidential.
Power Up Your People resources from CCRRC North America NACS
How Employee Engagement Works.
This series of short presentations uses the academic evidence to explain what employee engagement is, how it impacts business performance, and which organizational building blocks are required to create and sustain it.
Powering Up Employee Engagement: A Flash of Light.
In a series of short videos, C-store supervisors and managers tell firsthand stories of what happened when they applied employee engagement principles in their own stores.
Business Benefits
People power: How much is it worth?
Studies involving thousands of companies, diverse job levels, and millions of employees consistently show that there’s a strong relationship between employee engagement and better business results.
Now we can say with certainty that this is true for the convenience industry, too.
This research clearly documents that higher staff engagement at c-stores leads to better business outcomes.

Better customer service and increased customer loyalty

Associates who actively promote the business to friends and family

Faster speed of service

Lower employee turnover
Even the best performers have plenty of room to capture gains.
Some convenience retailers have higher average engagement scores than others — but the store-to-store variation within banners shows that even strong performers have plenty of room to capture gains.
What does the academic research say about the business benefits?
Profitability
High engagement firms were 22% more profitable than low engagement firms in one study and 10% more profitable in another.
Turnover
High engagement firms have lower turnover rates. 25% less in one study and 10% in another.
Shrinkage
Typical results show a 28% difference in shrinkage levels between engaged and non-engaged employees.
From How Employee Engagement Works, by Blake Frank, PhD, for the CCRRC North America NACS Power Up Your People project.
Spread the word: More satisfied customers and better brand ambassadors
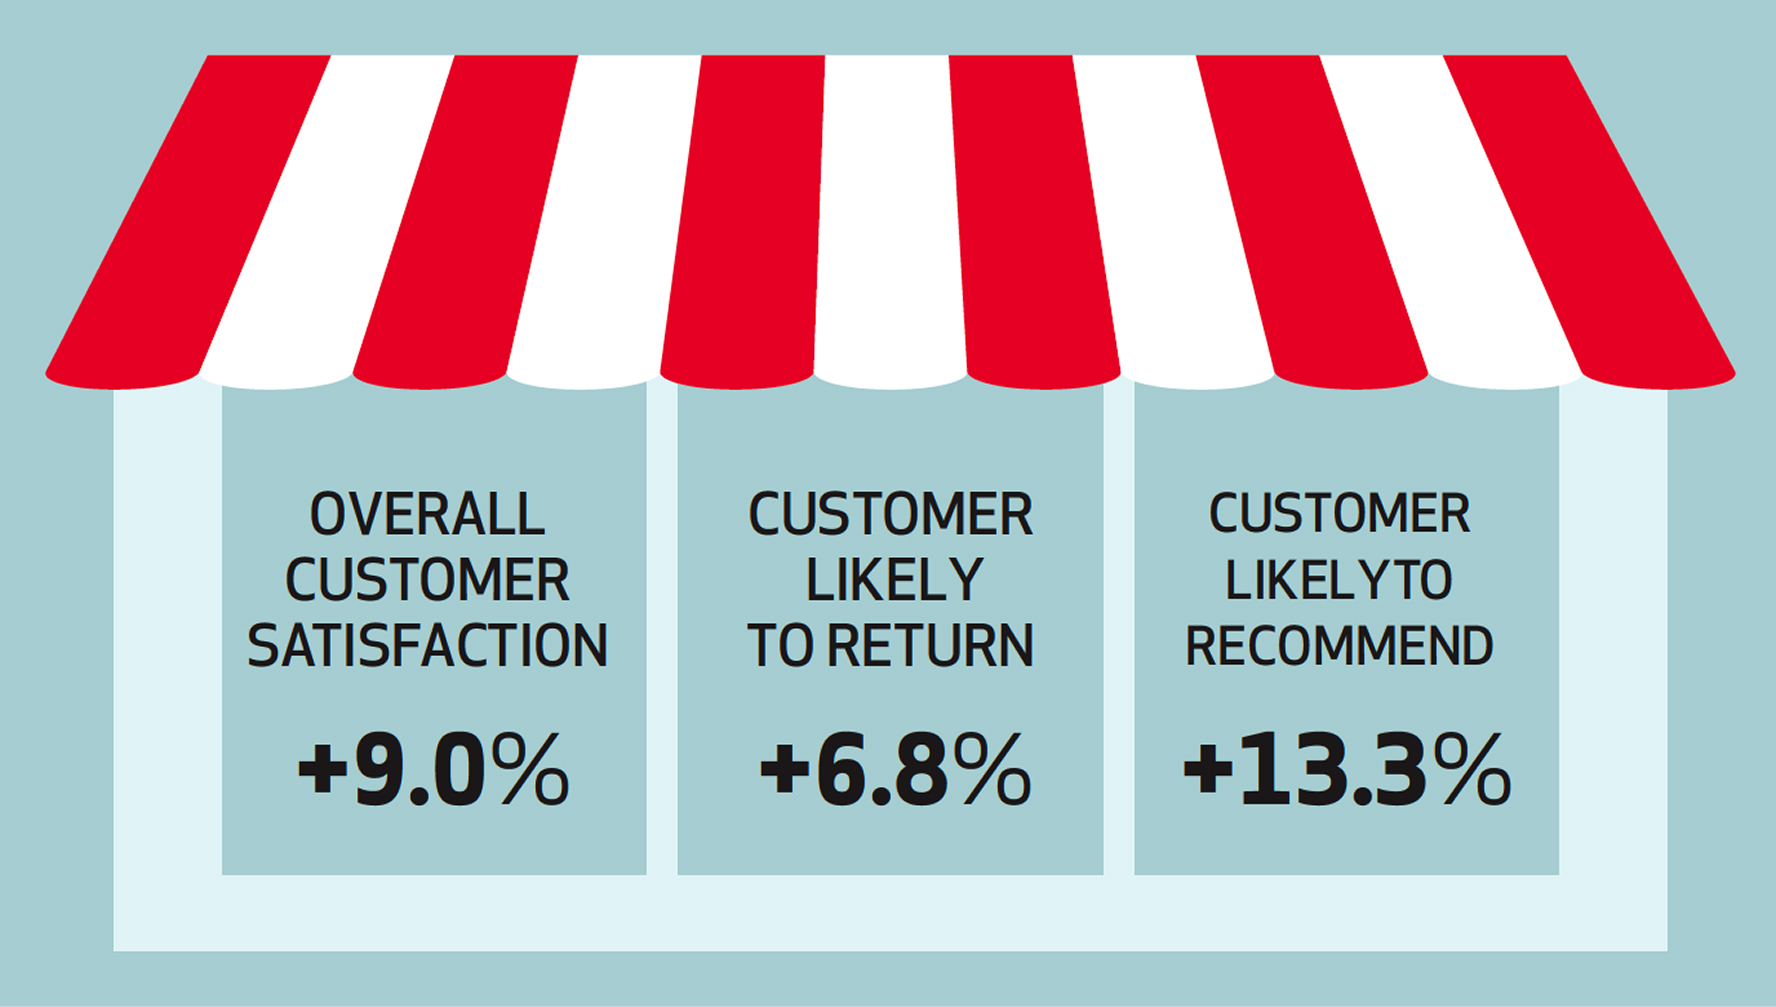
Customer satisfaction and loyalty goes up when employees are engaged — and the biggest gain is on the important dimension of “likelihood to recommend this store to a friend or neighbor.” On the other side of the counter, highly engaged employees are far more actively involved than less engaged employees in promoting their stores to friends and family.
Customer satisfaction and loyalty
Top 20% of stores on employee engagement compared to bottom 20%
Stores in the top 20% of employee engagement scored significantly higher across all three dimensions of customer service than those in the bottom 20%.
Employees as brand ambassadors
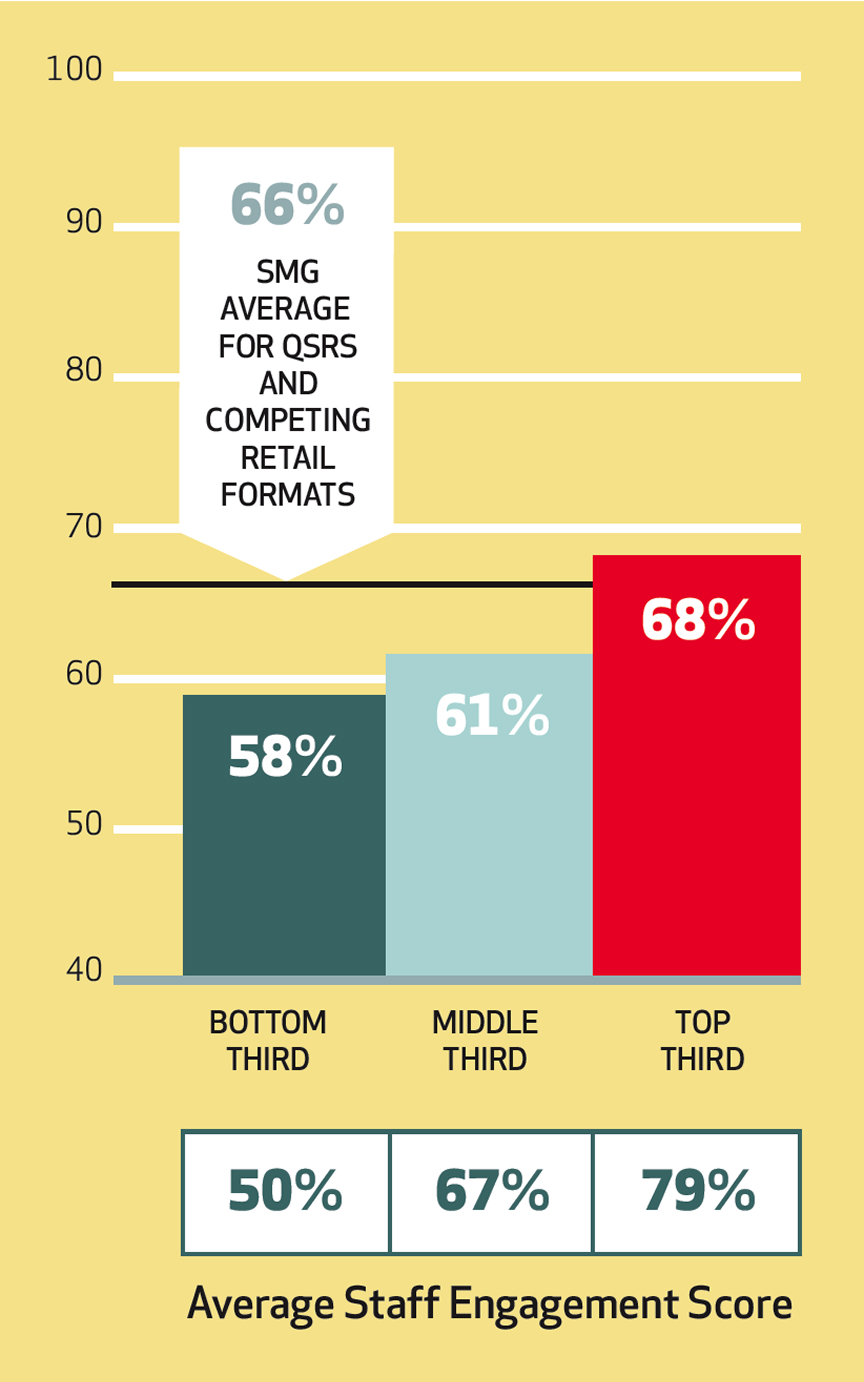
Would you recommend shopping/dining at this store to friends and family?
% who strongly agree
Greater employee engagement creates better brand ambassadors.
Get ready to zoom: Higher engagement drives faster service
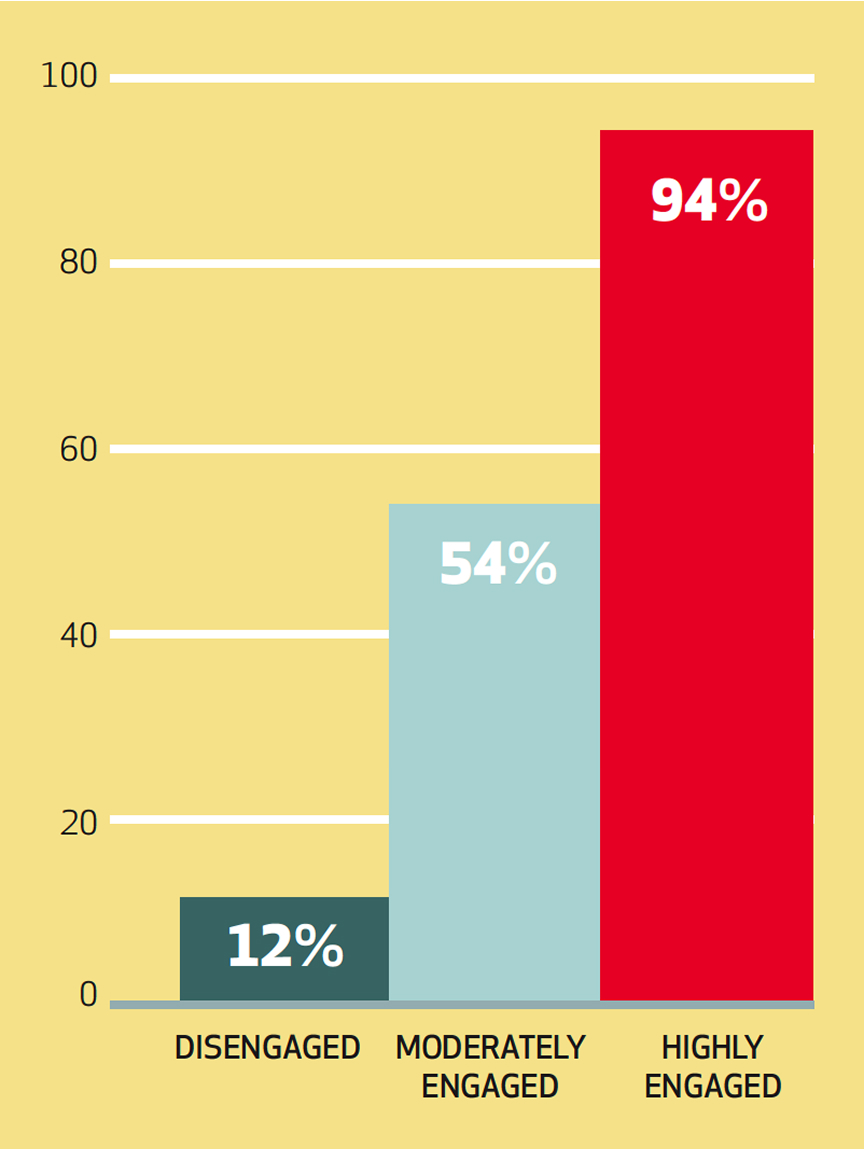
One reason higher employee engagement produces better in-store experience is its impact on “speed of service.” Stores with more highly engaged employees score higher on fast service — and higher than retailers who compete with c-stores for the same labor market, such as QSRs.
Highly engaged stores are top performers on speed of service.

Staff engagement and speed of service
% of customers highly satisfied with speed of service
Bottom line: Less turnover and more profit
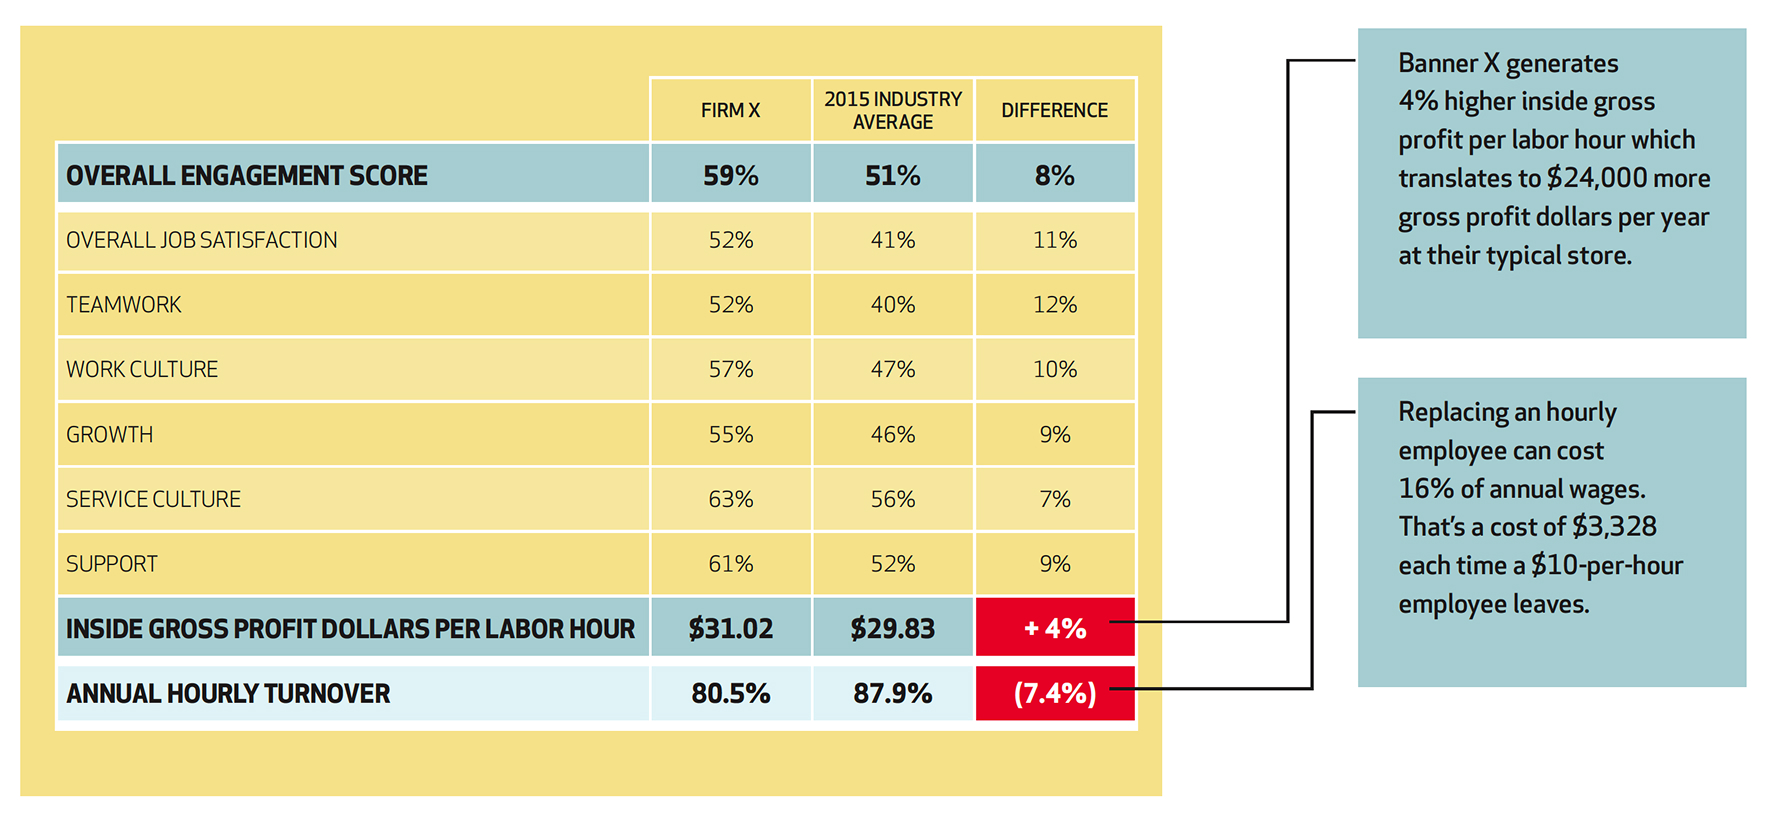
Higher levels of employee engagement are related to both higher profit and lower turnover. The impact shows up clearly when we compare the engagement scores from one of the participating banners with the 2015 industry average from the NACS State of the Industry Survey.
Engagement and operational profitability
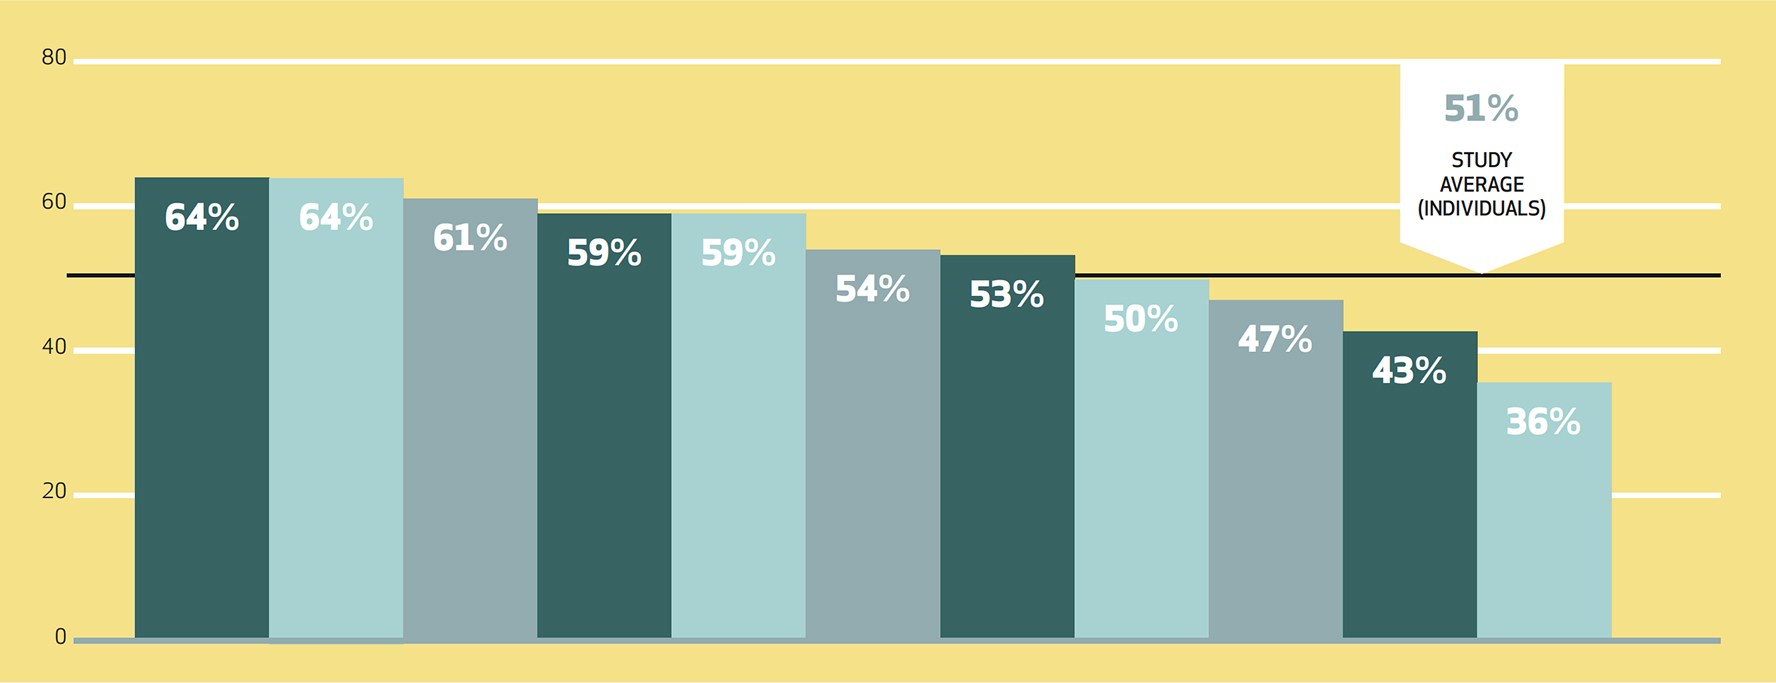
Some banners perform better than others on employee engagement...
Overall engagement scores ranged from a high of 64% to a low of 36% among the 11 banners studied. Averaging the scores of all individual respondents results in a study average of 51%.
Overall engagement scores by banner
% represents the overall engagement score for that banner
...but store-to-store variation shows even strong performers can capture gains.
Even among convenience retailers with high banner averages, some stores perform far better than others on engagement. The chart below shows that every company has “headroom” for improvement and the opportunity to capture business benefits from employee engagement efforts.
Store-to-store variation within banners*
Percentages refer to store engagement scores
Left to right, the banners are arrayed from the highest degree of variation to the lowest.
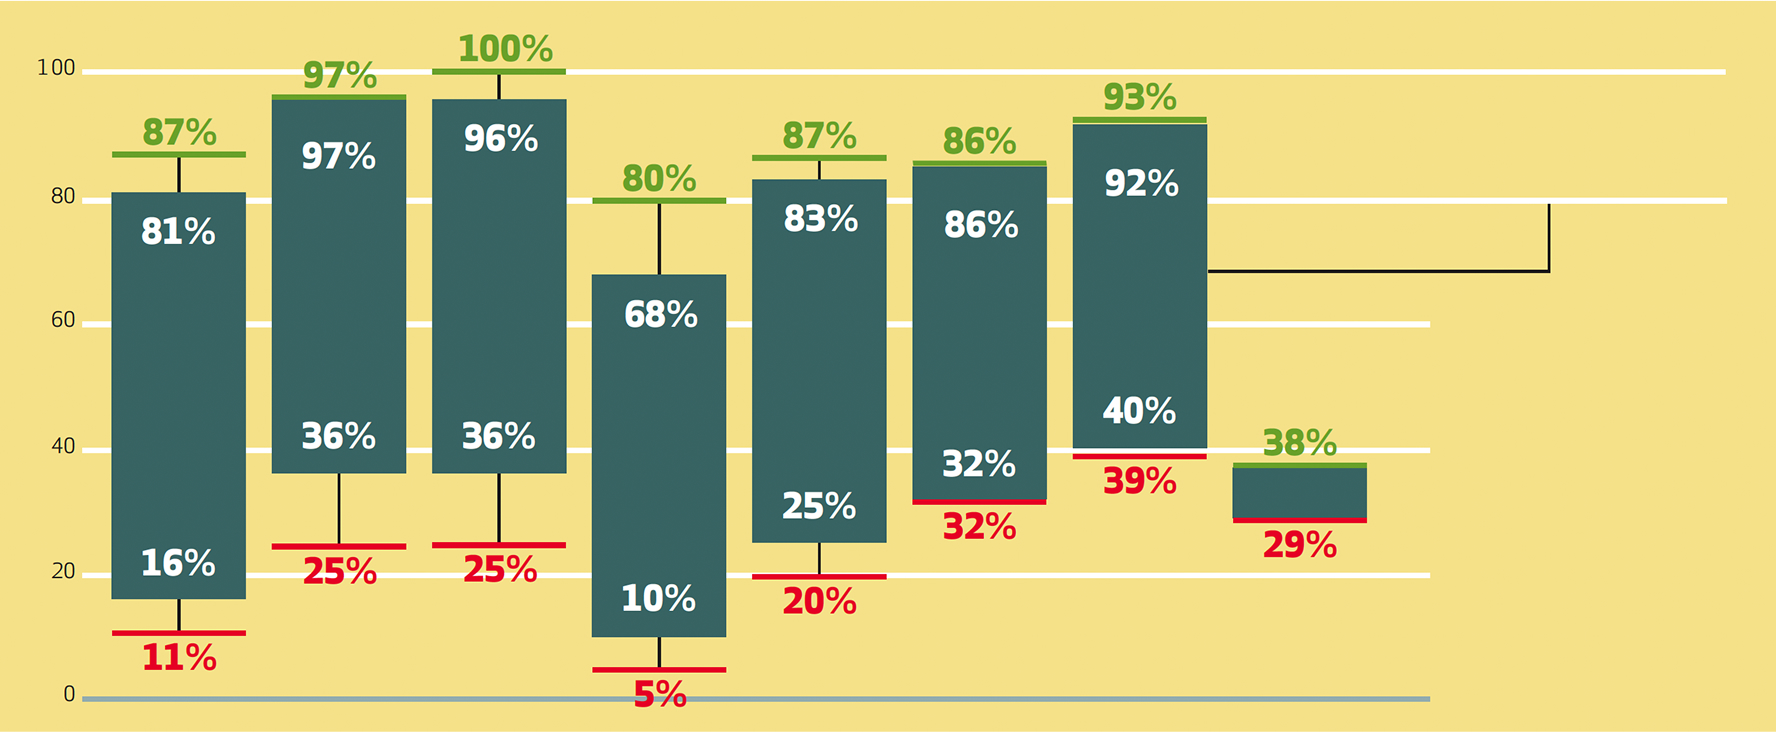
*Only stores with 15 or more respondents are included.
Finding the opportunity zone
The green lines represent the banner’s highest scoring store (which don’t need improvement) and the red lines the lowest (these may be beyond help). The opportunity zone is found in the blue boxes. They show the wide range of engagement scores for 95% of the banner’s stores.
Engagement Drivers
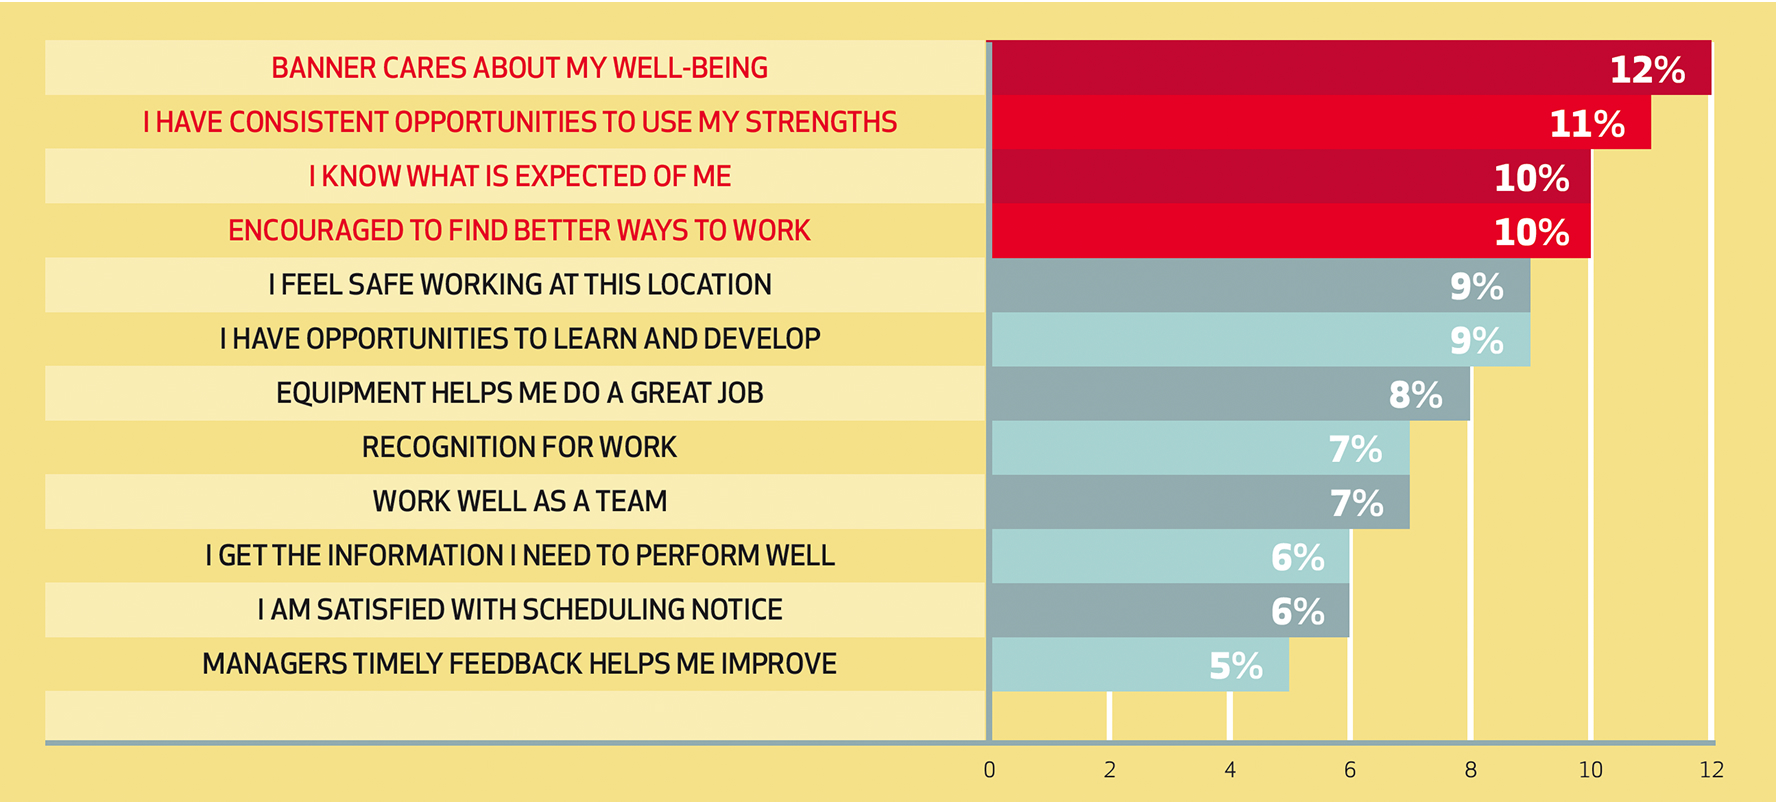
Many factors combine to increase employee engagement. All of them make a difference, but some have more impact than others in convenience retailing. When we asked employees what mattered most to them, four things stood out:
- Company concern for their well-being
- Opportunities to use personal strengths
- Clear expectations
- Encouragement to find better ways to work
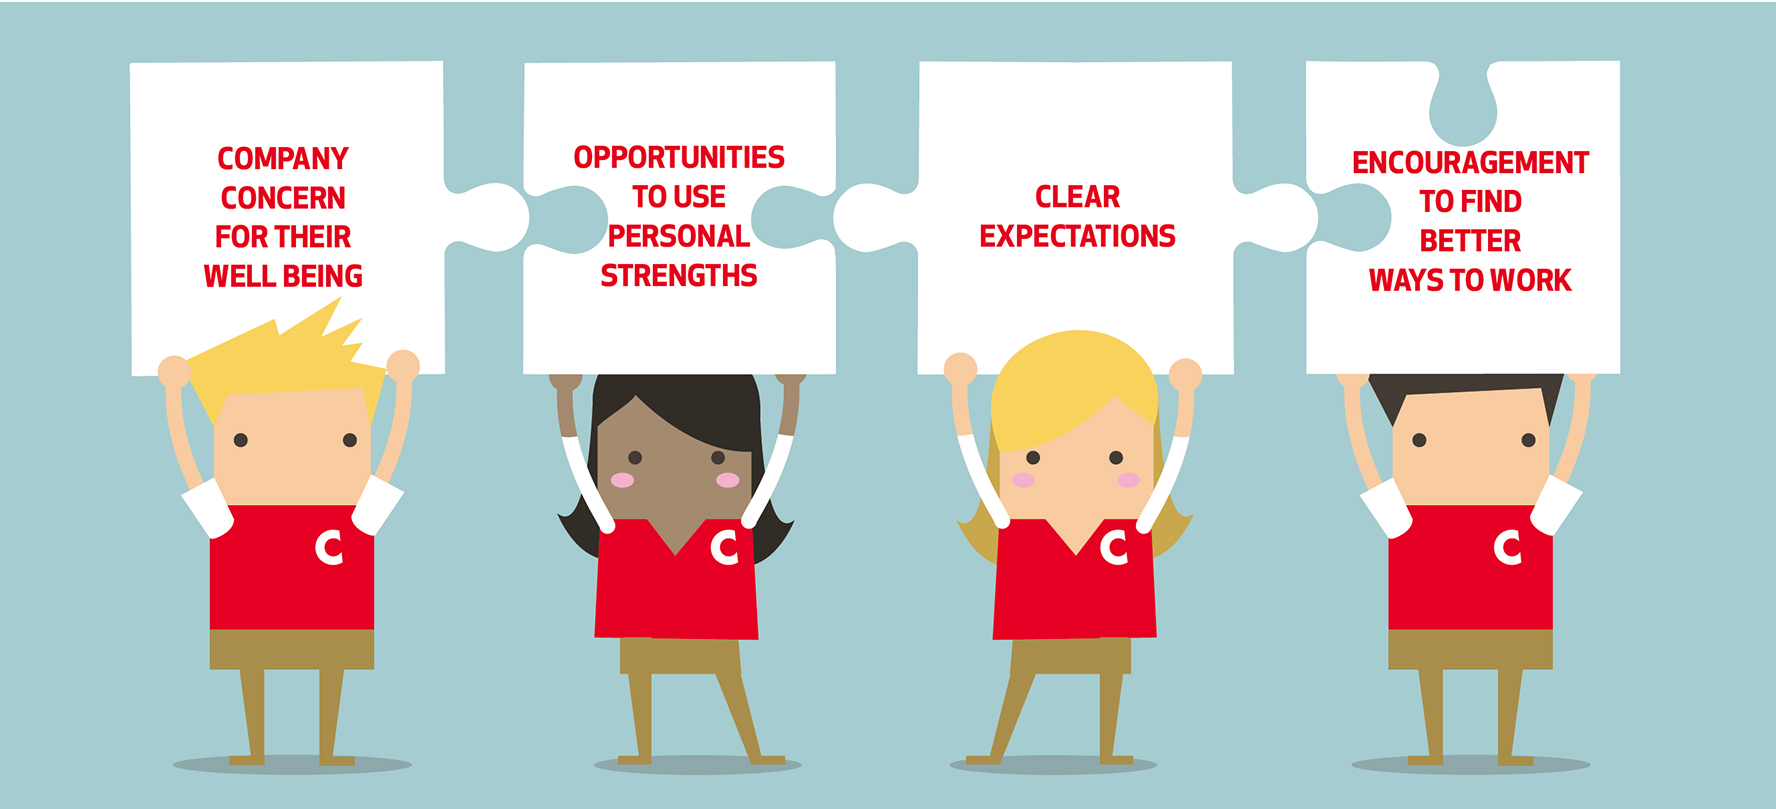
What matters most to employees?
If a retailer can concentrate on only a few areas, the red sections in the infographic below is where they will get the greatest returns.
Key engagement drivers
But don’t forget about safety.
Not feeling safe hinders employee engagement — a lot! When asked if they felt safe working at this location, the average engagement score for those who answered “strongly agree” was 69% — all others — even those who answered simply “agree” as opposed to “strongly agree” — scored in the 20s or below.
Key related driver: the banner cares about my well-being.
Engagement scores and perceptions of safety
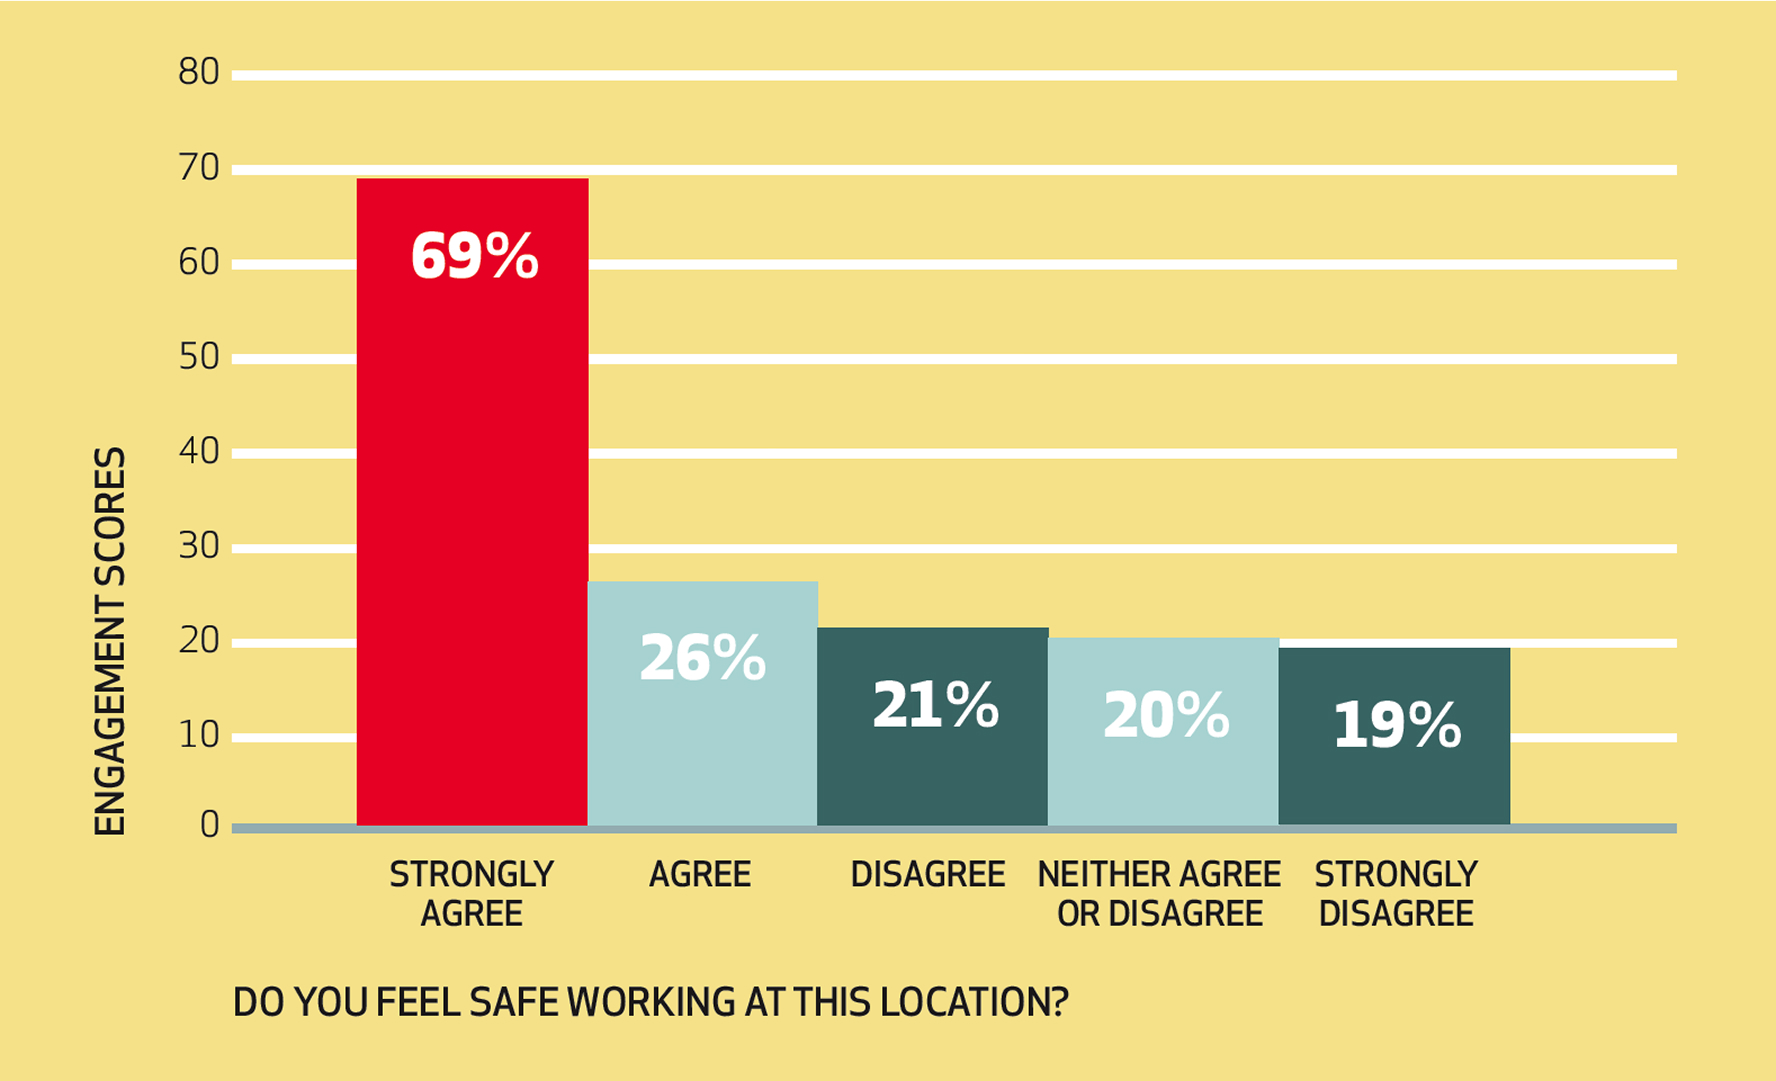

Making sure employees feel safe on the job is an important issue to address if you want to build strong engagement.
Full-time associates are more engaged than their part-time peers.
Associates who are employed full-time have higher levels of engagement across the board than their part-time counterparts.
Related drivers: cares about my well-being, opportunities to use strengths.
Engagement by position - part-time and full-time
% top box (respondents answered “strongly agree” or “highly satisfied”)
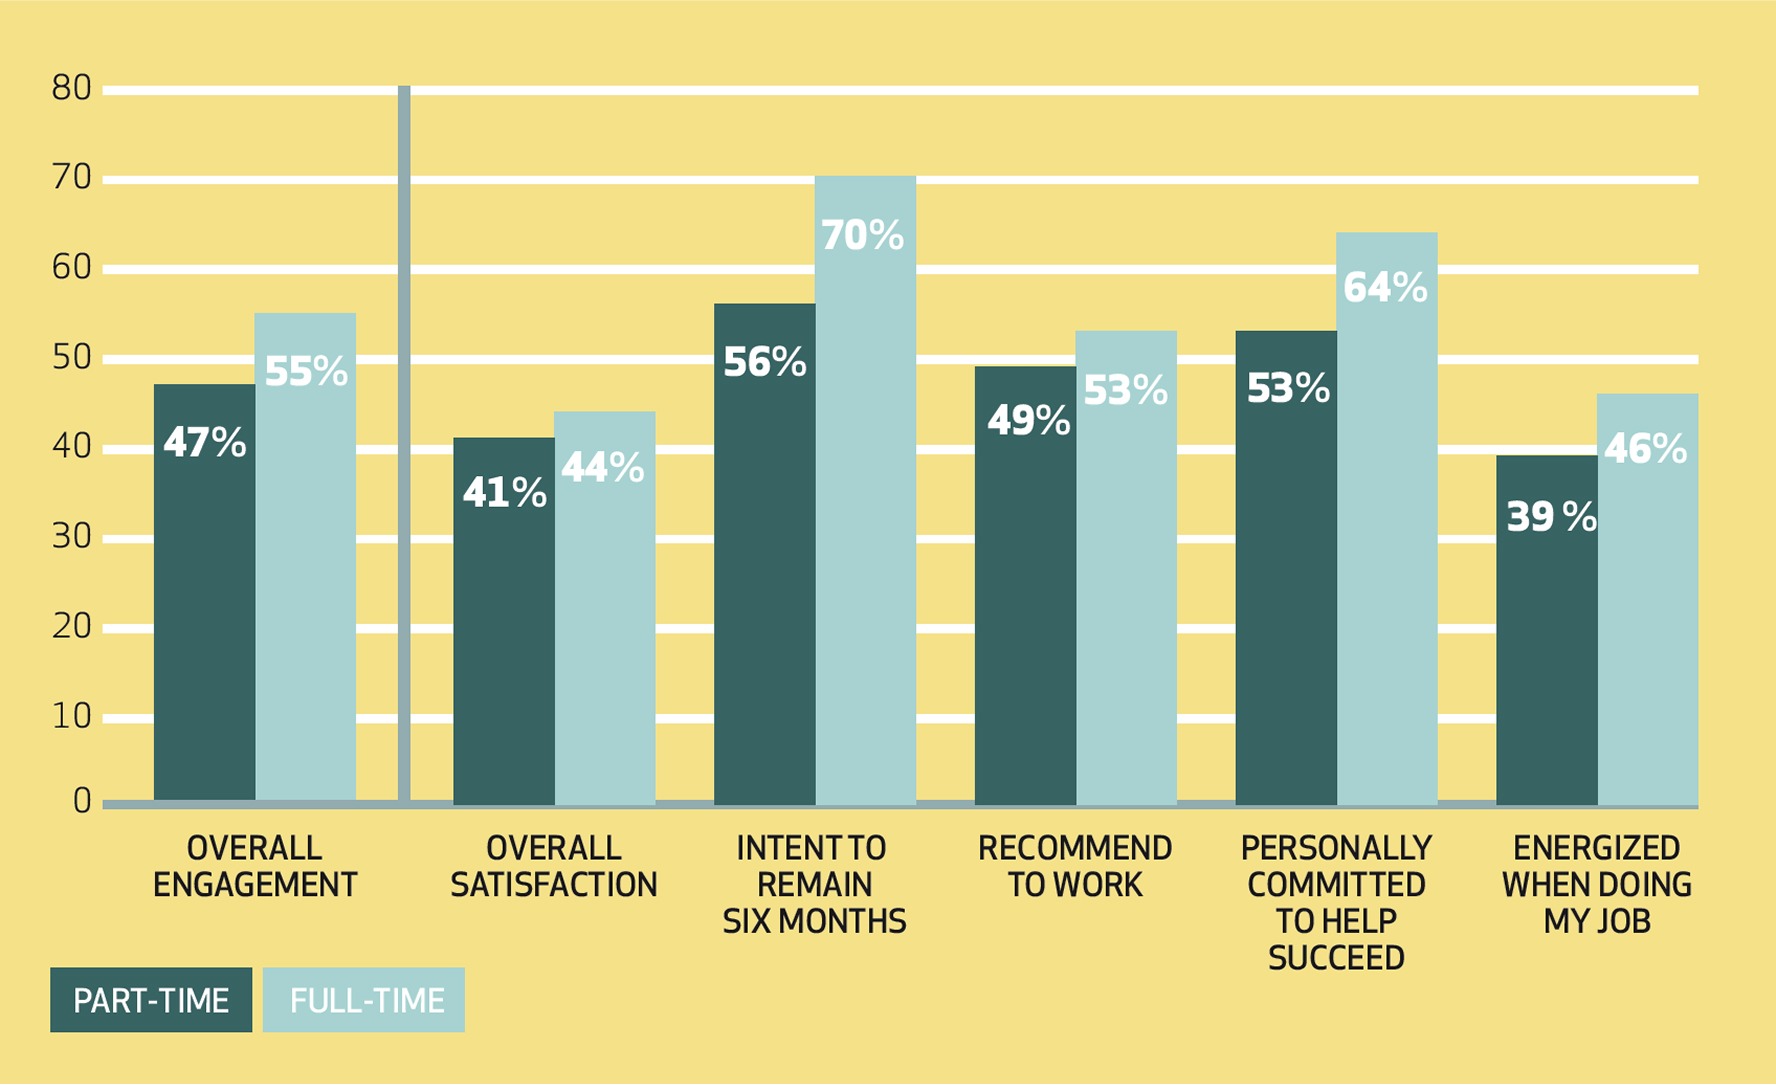

Some convenience retailers are increasing the number of full-time employees in the workforce to improve employee engagement.
Engagement increases with responsibility.
Managers showed higher rates of engagement than non-managers, except at one banner surveyed.
Related drivers: opportunities to use strengths, encouraged to find better ways to work.
Engagement by position - managers and non-managers
% top box (respondents answered “strongly agree” or “highly satisfied”)
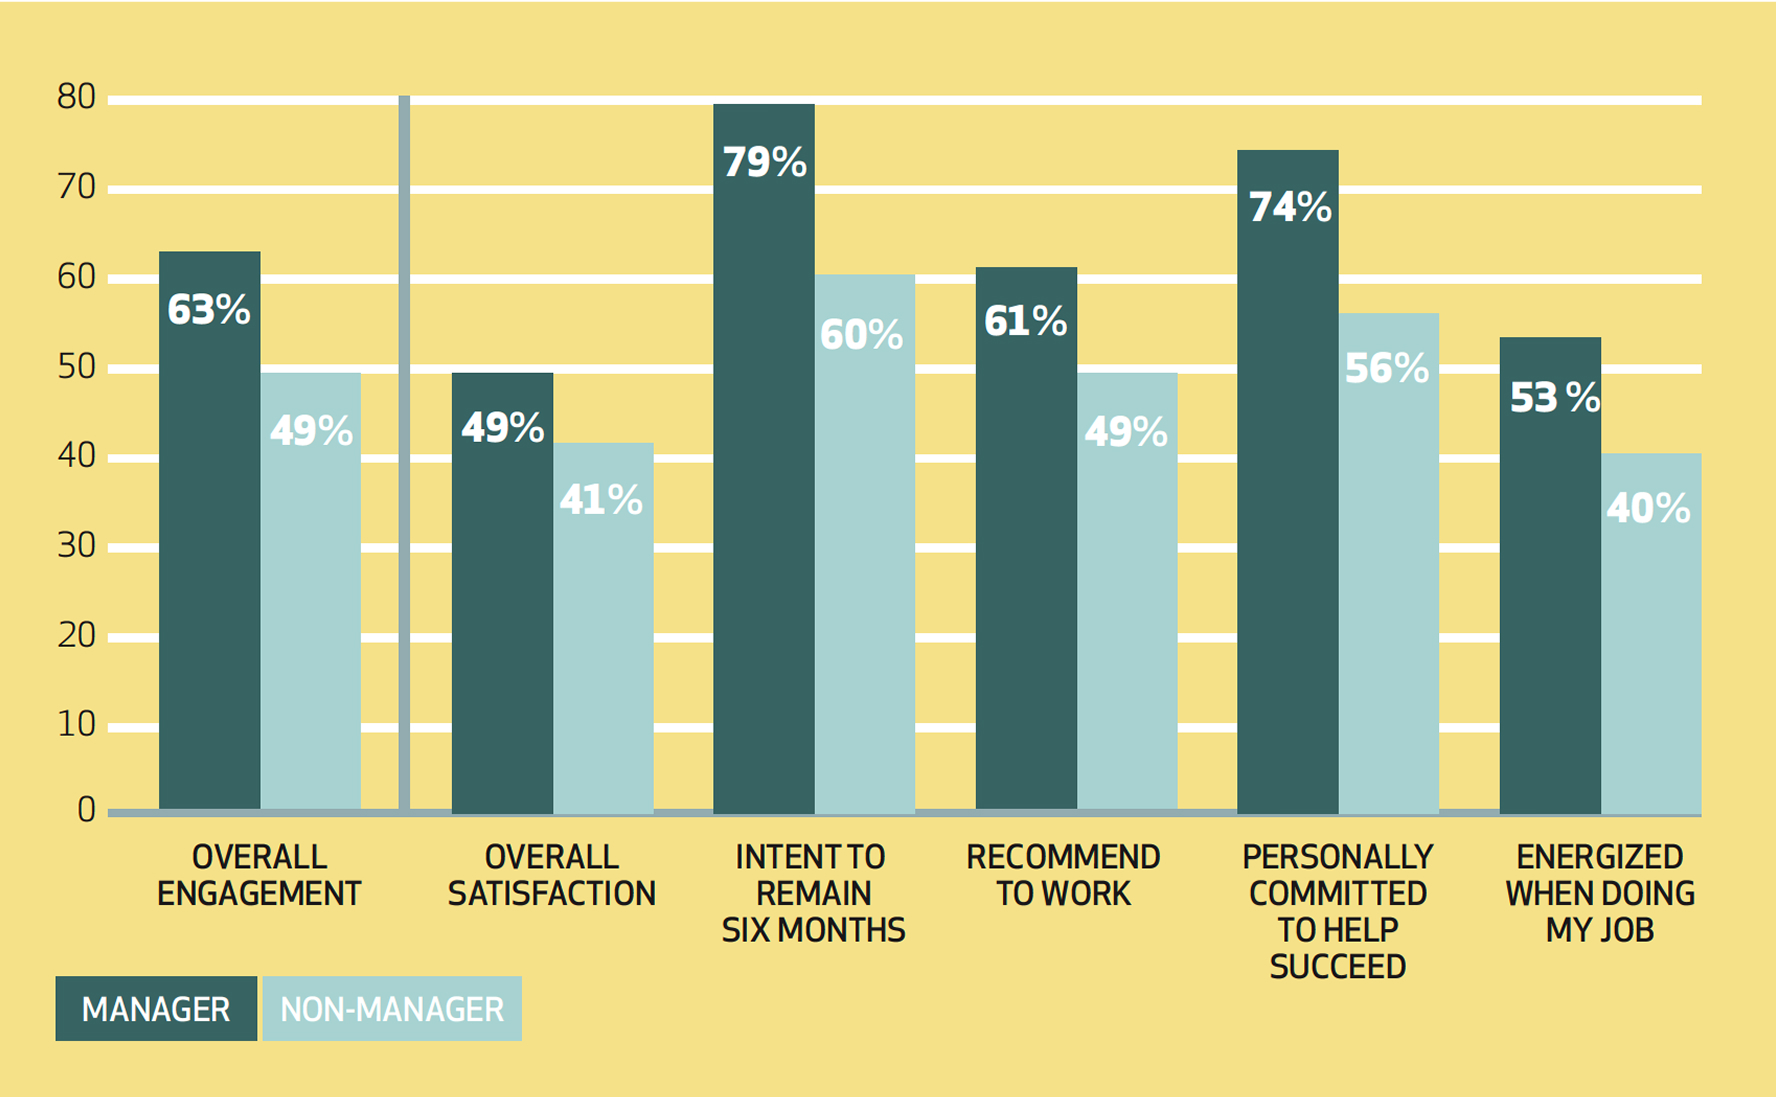
More responsibility increases non-manager engagement, too.
Darrell Meek, Operations Manager, J.D. Street & Co., from the first-person videos developed by the Glen Douglas Group for the CCRRC North America NACS Power Up Your People project:
You would think that by empowering your employees, and giving them more ability to make decisions, the end result would be that they would run over you, and do less work, play more, goof off, or just not do what they’re supposed to. But in reality, you get the exact opposite effect. You get employees who become engaged, and take ownership in their job, and become part of the company, instead of just the person behind the counter.
Voices from the field
Employees were asked to comment on what they found most satisfying in their workplaces and what they felt could be improved. Here’s what they said.

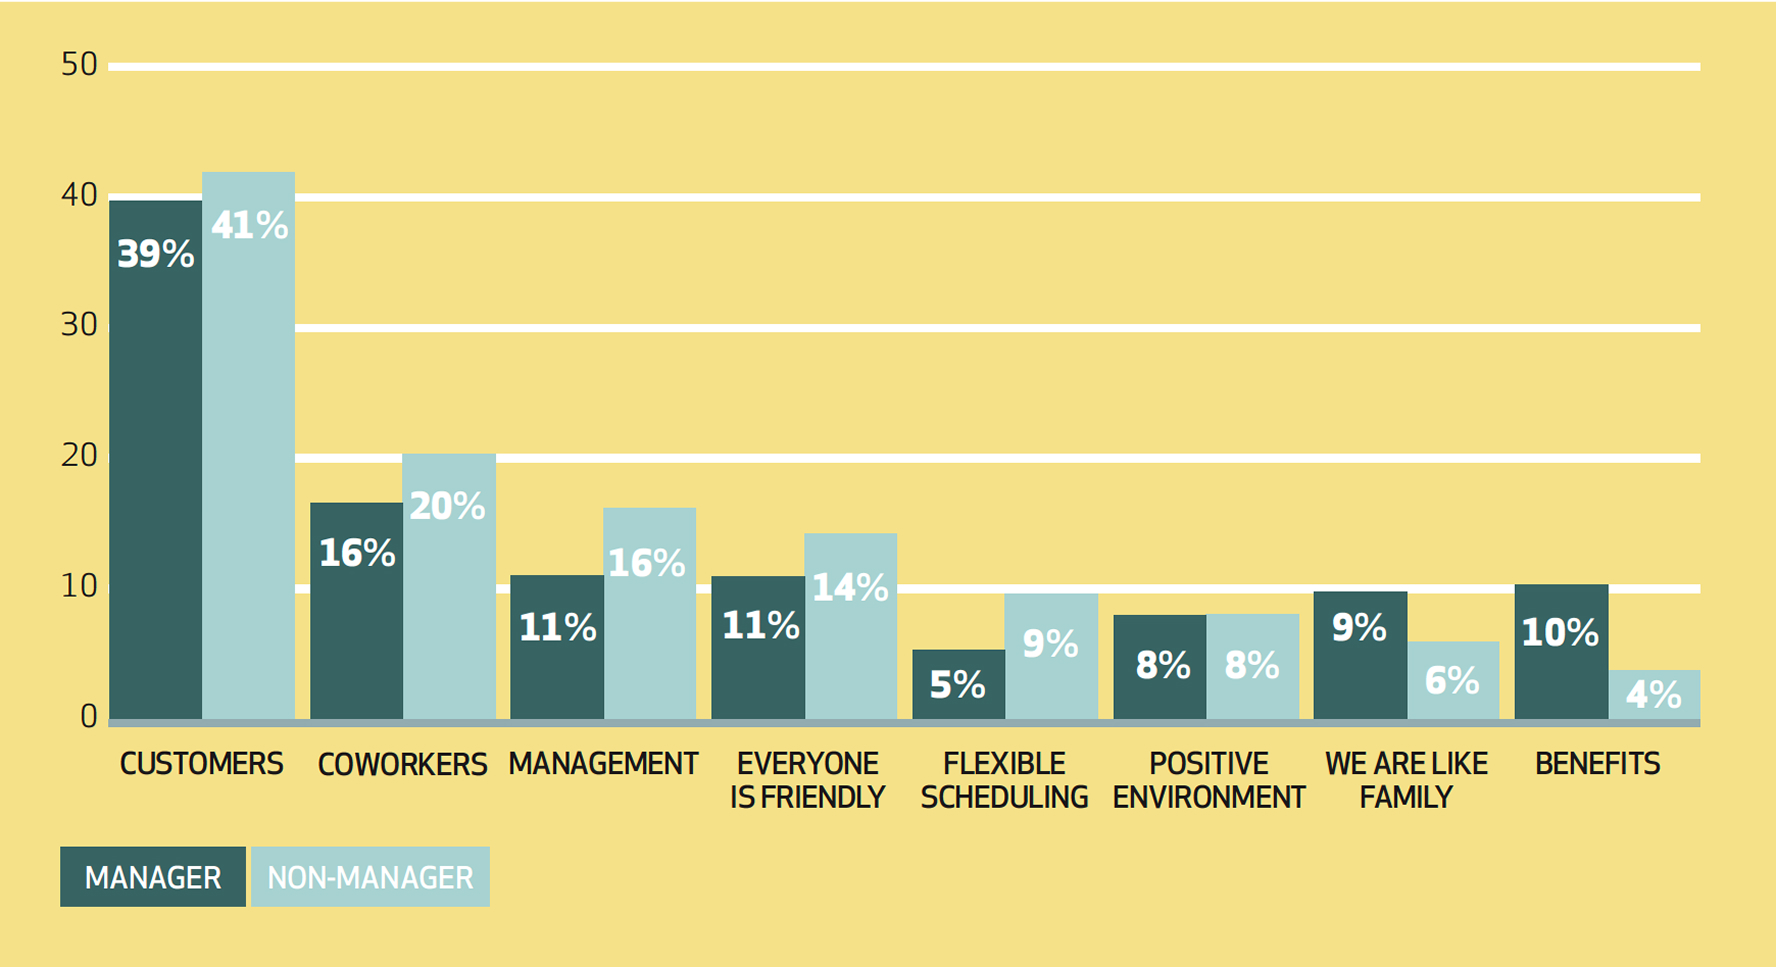
The best part of the job is customer interaction.
Convenience retail employees get strong positive feelings from dealing with customers. While there are some expected differences between manager and non-manager responses, it’s clear that customer interaction is what really “lights up” both groups. The energy they draw from dealing with customers comes through loud and clear in their comments.
What’s the one thing you like best about working for your company?
% of comments (more than one response allowed)
I love to work with the guests. Interacting with them puts a smile on my face. With it so busy most of the time, we see many people everyday.
Fun to get to meet so many different types of people.
Concerns about management, pay, and resourcing/scheduling surface when asked what needs improvement.
These responses shed light on what employees feel is limiting their ability to do a good job. Issues related to management, pay levels, and scheduling are the most commonly mentioned.
What’s one thing the company could improve?
% of comments – managers and non-managers combined*
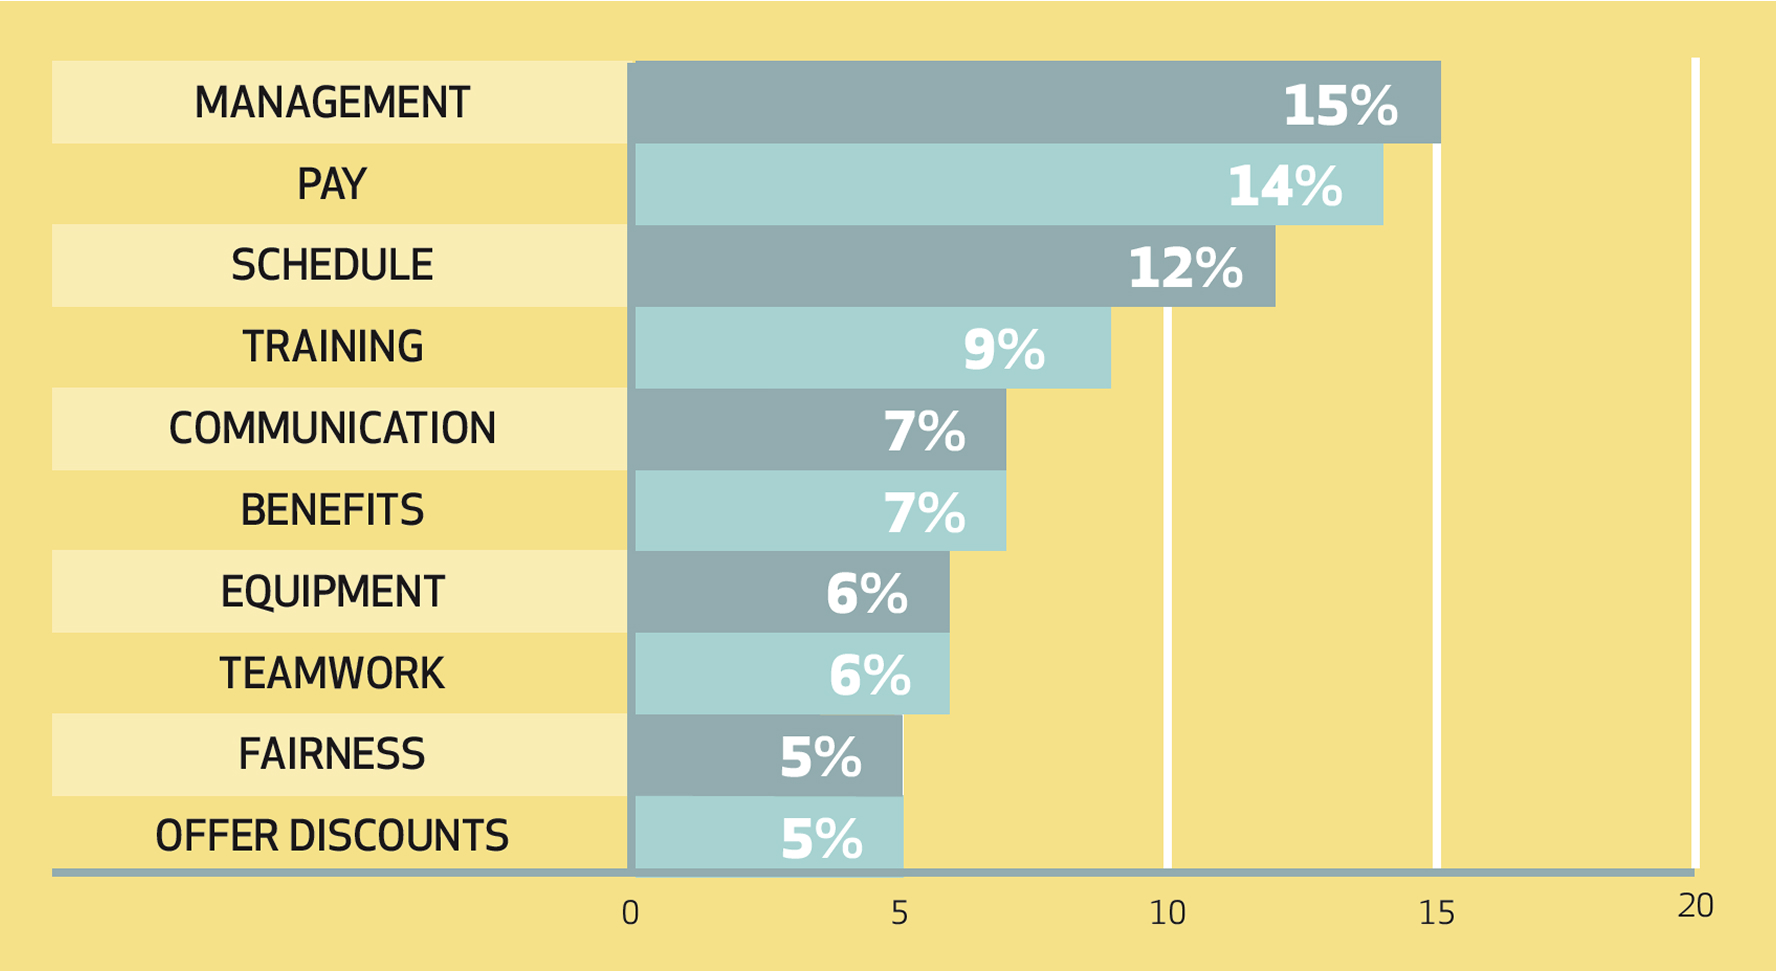
*Percents do not add to 100
I simply cannot make a living being compensated so poorly for my efforts. I work 40 hours per week and these are long, hard hours and I bring home less than $275 per week. In this area I cannot even pay my rent with that.
There are occasions where more staffing is needed to accomplish the tasks for the day, but these are only during busy times.
I wish that managers could reward the employees who they see doing a lot of the work all of the time.
More (and better) store meetings are needed - non-managers
Non-manager concerns focus on making sure everyone gets the information they need.
Better communication in the stores. Maintenance tells us one thing that managers had no idea about. In another situation managers were becoming frustrated with employees for doing something according to an old policy because they were not told that the policy had changed. Store meetings are held when the majority of part-time employees are unavailable.
Regular store meetings to help keep everyone ‘on the same page’ so to speak. Manager meetings that include both assistant managers so we can help our manager with any new changes that will be coming to the store as well as support her with ongoing changes.
Have store managers provide one-on-one meetings with their employees every six months to ensure that everything is on track with the employee’s goal, whether it be in regards to moving up or even just scheduling.
Schedule more store meetings with all managers and employees.
Managers want improvement in pay and scheduling.
For managers, the top candidate for improvement was pay — their own and their employees.
What’s one thing the company could improve? (Managers)
% of comments*
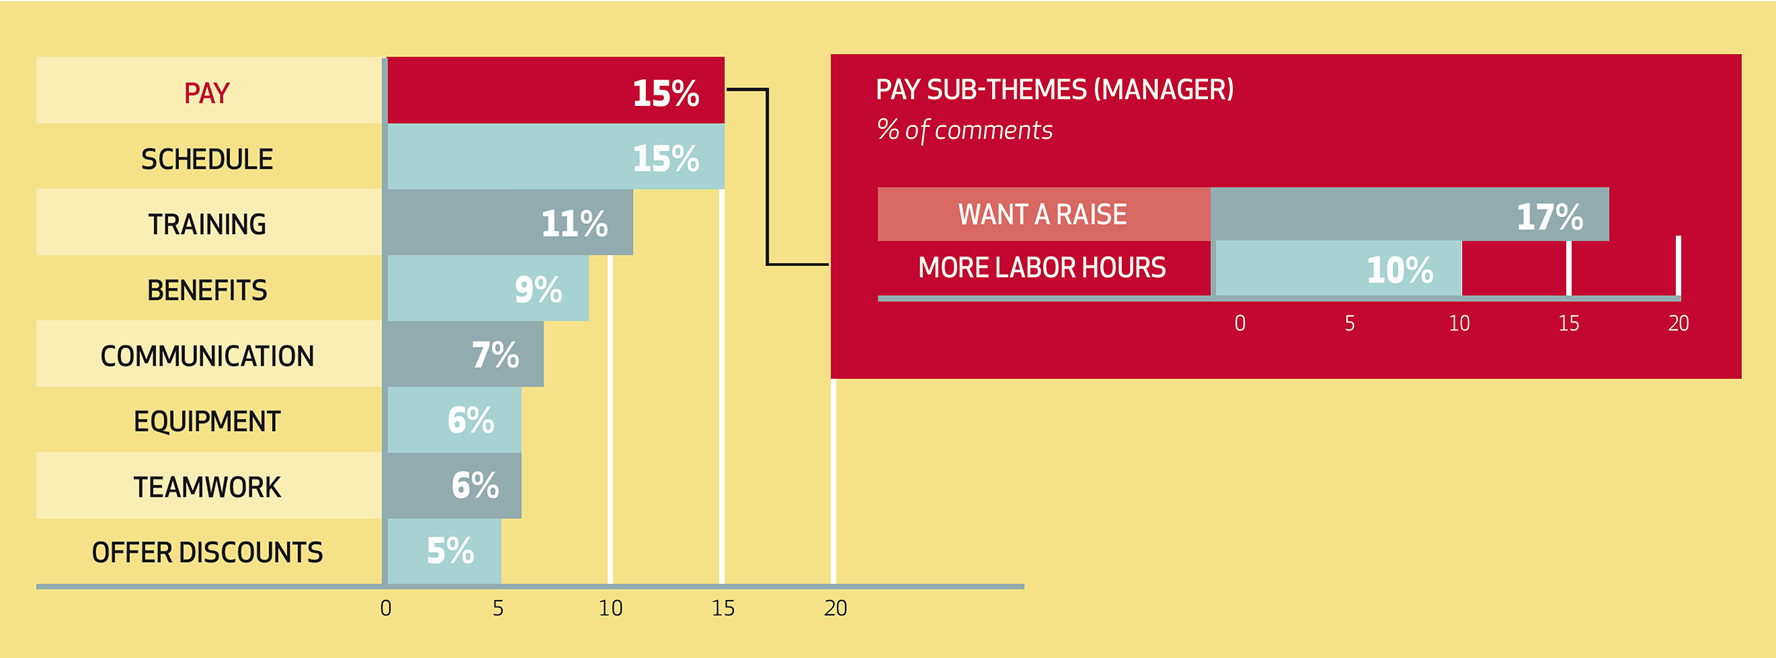
*Percents do not add to 100
Some managers argue for higher pay and greater flexibility on behalf of their employees.
The demands are very high in this competitive business. We are never given the needed payroll hours in order to do the job that is expected of us. We cannot clean, cook, stock and run the store while giving the customers the time and attention that the company expects.
Pay the employees more. It is hard to find good honest working people, I can’t pay them enough and they go to another job because the pay is better.
Try to encourage more opportunity for raises for those that continue to work hard. It shows that they are appreciated.
Raise the starting wage so we can hire better people. Have monthly meeting to keep track of our progress.
Annual raises. Take into account the cost of living and what the employees are paid per hour.
How retailers can use this report
The key findings in this study confirm that improving employee engagement can power up your c-store business.
Increased employee engagement improves business results in convenience retail.
There are specific actions that managers can take to impact engagement.
Retailers who want to take advantage of this opportunity should make use of all three parts of the Power Up Your People project. Here are some ways to get started.

Start at the top
Implement actions based on the major findings of this research.
- Higher Employee Engagement = Higher Profits
- Across stores within the same companies, there are huge variations in engagement.
- Full-time associates are more engaged than their part-time peers.
- What matters most to employees:
- Company concern for their well-being
- Opportunities to use strengths and to grow
- Clear expectations
- Feeling safe
- The best part of the job is customer interaction!

Educate the team
The best results are achieved when everyone from the top down understands the value of employee engagement to the company and supports efforts to improve it, according to Council members who have worked to improve employee engagement in their organizations. The materials from this project can help you accomplish this.
- Review the step-by-step explanation of what employee engagement is, how it impacts business results, and what’s required to create it in How Employee Engagement Works, by Blake Frank, Ph.D. These five brief presentations provide a clear understanding of the building blocks of employee engagement.
- Review the firsthand video testimony of convenience store supervisors and regional managers to find out what they did to increase engagement and what they learned in the process. The compelling stories in Powering Up Employee Engagement: A Flash of Light contain a lot of practical suggestions.
- Review the findings of this study, People Power for C-stores, to get a more detailed feel for the employee engagement issues and opportunities in convenience retail.
This will position you to decide how much time, money, and effort you’re ready to invest in employee engagement.

Build a foundation for sustained success
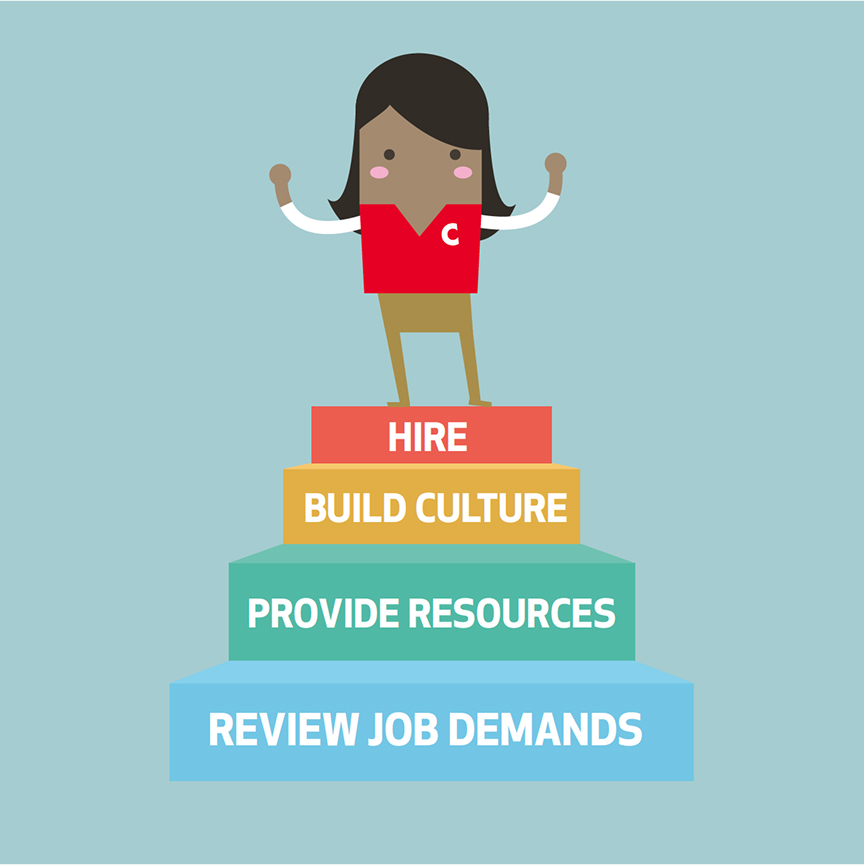
You may want to put the four building blocks that support high employee engagement in place in your organization. These are summarized below and explained in detail in the How Employee Engagement Works presentations.
- Hire people with the personality characteristics that predispose them to become engaged (stability, openness, optimism, and extroversion).
- Build a culture that encourages and supports employee engagement through leadership that provides vision, sets clear expectations, and fairly recognizes performance.
- Provide the resources employees need to fulfill their responsibilities — the equipment, tools and information necessary to do the job successfully.
- Review job demands to ensure they are clear and realistic, and that they offer challenges and ways to make meaningful contributions.
Survey your employees
The place to start is to assess where you currently are with employee engagement. That’s the core of what this research was designed to address.
- Self-surveys are a way to get a quick read on employee engagement, however its value is limited by a couple of factors: If the surveys aren’t administered consistently, they won’t be comparable, and employees may not provide accurate feedback because they’re not certain that their responses will remain anonymous.
- To conduct a survey like the one used for this study, SMG is working with NACS to provide four opportunities over the next year for NACS members to sign up in advance and have their employees professionally surveyed. This option will provide quality results, but it does require a commitment by each company to explain and administer the survey, and there will be a fee. To learn more about this opportunity, contact Dae Kim, NACS Senior VP Research at dkim@nacsonline.com
The Council and NACS are developing a comprehensive set of tools to help retailers take action steps to increase the level of employee engagement in their companies.
Additional resources
Powering up employee engagement: A flash of light
This six-part video series, developed by the Glen Douglas Group, uses real people, real stores and real results to show you what success looks like. Hear a cross-section of convenience store district and regional managers tell what happened when they applied employee engagement principles in their stores. These managers made changes that had a positive impact on their businesses.
How employee engagement works
Blake Frank, PhD, of the Gupta College of Business, University of Dallas, explains what the research-based evidence says about how employee engagement can aid in business growth in five short presentations that cover what employee engagement is, how it impacts business performance, the organizational building blocks required to create it, and how to get started.
Acknowledgements
The Council wishes to thank Service Management Group for conducting the extensive survey research for this report. We also wish to extend our appreciation to Bill Bishop of Brick Meets Click. For many years, his guidance has helped ensure that Council projects are always timely, relevant, and useful. Thank you also to Susan Lindsay and Randy Allison, whose editorial and design contributions have made the delivery of that work lively, accessible, and interesting.
The NACS Coca‑Cola Retailing Research Council
Hal Adams
CST Brands, Inc.
Varish Goyal
Vintners Distributors, Inc.
Kevin Hess
Kwik Shop, Inc.
Steve Loehr
Kwik Trip, Inc.
Chuck O’Dell
QuikTrip Corporation
Joe Sheetz
Sheetz, Inc.
Hank Armour
NACS
Deborah Gullaher
Suncor Energy, Inc.
Dae Kim
NACS
Crystal Maggelet
Maverik, Inc./FJ Management, Inc.
Quinn Ricker
Ricker’s/Ricker Oil Company, Inc.
Peter Tedeshi
Tedeshi Food Shops
Chris Gheysens
Wawa, Inc.
Terry Handley
Casey’s General Stores, Inc.
Tom Lefevers
Speedway, LLC
Billy Milam
RaceTrac
Debbie Robinson
SPAR
Matt Thornton
Thorntons, Inc.
Who We Are
The NACS Coca‑Cola Retailing Research Council is composed of convenience industry leaders from around the world. It conducts studies on issues that help retailers respond to the changing marketplace. The unique value of these studies rests with the fact that retailers define the objective and scope of each project and “own” the process through the release of the study and its dissemination to the broader retail community.
Our Mission
To identify big issues facing convenience retailers, do research that uncovers ways to deal with them, and then encourage retailers to use these new ideas to improve their business.
